Displaying top or bottom values
For a cross tab that presents a large amount of numeric data, it is useful to view a snapshot of the highest or lowest values, such as the top 100 order totals or the counties whose median home prices are in the bottom 10 percent. To display top or bottom values, use the Bottom N, Bottom Percent, Top N, or Top Percent operators.
For example, to display the top 100 values for OrderAmount, select Top N, and specify 100.
To display the bottom 10 percent of Productline revenues, select Bottom Percent, and specify 10. If there are 1000 rows of data, the cross tab displays 100 rows.
How to display top or bottom values
1  
2  
*
*
*
*
*
*
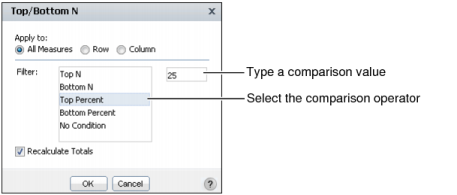
Figure 5-19 shows Top Percent selected. The specified comparison value is 25.
Figure 5-19  
Choose OK.

Additional Links:

© Copyright OpenText Corp. All rights reserved. Privacy Policy | Cookie Policy

BIRT iHub 2