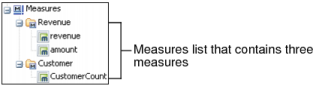
To customize a cross tab, you can add, remove, or reorder measures. You can add one or more measures from the available cube data, which appears in the data pane. Figure 3-13 shows a list that contains three measures: revenue, amount, and CustomerCount.
|
Figure 3-13
|
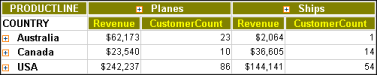
A cross tab displays multiple measures in adjacent columns or rows. For example, Figure 3-14 displays Revenue and CustomerCount columns in each product line column.