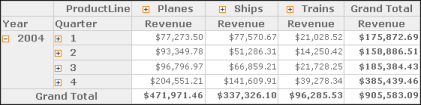
Pivot a cross tab to swap the axes. Figure 3-30 displays a cross tab before pivoting the axes.
|
Figure 3-30
|
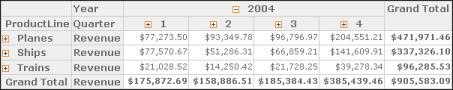
Figure 3-31 displays the cross tab after pivoting the axes.
|
Figure 3-31
|
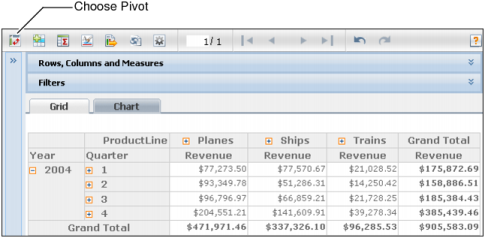
|
Figure 3-32
|
Data Analyzer pivots the cross tab, displaying the year and quarter groups as the column headings, as shown in Figure 3-33.

|
Figure 3-33
|