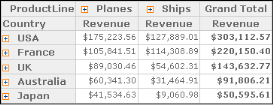
Compare the cross tabs in Figure 3-34. The cross tab on the left displays products’ sales revenues by alphabetically sorted country names. The cross tab on the right displays the same sales revenues, sorted from the highest to lowest in the grand total column.
|
Figure 3-34
|
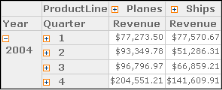
Data Analyzer supports sorting values in a column or row, or for dimensions that appear in hierarchy levels, you can apply sorting to a hierarchy level. For example, for the time period hierarchy of year and quarter, applying the sort to a hierarchy level displays levels in ascending or descending order, as shown in Figure 3-35.
|
Figure 3-35
|