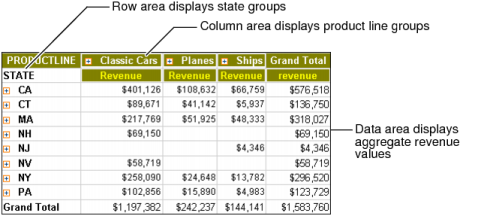
Figure 1-1 shows a cross tab that organizes state groups in the row area and product line groups in the column area. In the data area, aggregate revenue values appear in the cells. In this cross tab, the aggregate values are sums.
|
Figure 1-1
|
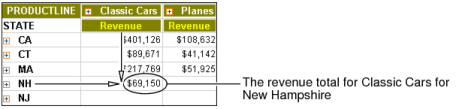
At the intersection of a column and a row, a cell displays a revenue value by product line and state, as shown in Figure 1-2.
|
Figure 1-2
|
A cross tab uses data from at least three fields. The cross tab in Figure 1-1 uses the following data fields:
|
|
One field provides the values for column headings in the cross tab. The cross tab displays one column for each unique value in the field. In Figure 1-1, the cross tab displays three unique values from the productline field: Classic Cars, Planes, and Ships.
|
|
|
One field provides the values for row headings in the cross tab. The cross tab displays one row for each unique value in the field. In Figure 1-1, the cross tab displays eight unique values from the state field: CA, CT, MA, NH, NJ, NV, NY, and PA.
|
|
|
Data Analyzer aggregates one field’s values and displays these values in the cross tab cells. In this example, each cell displays a revenue total by productline and state. Data Analyzer calculates the revenue total using the SUM function on the values in the extendedprice field. Figure 1-2 shows a part of the cross tab with a circled value at the intersection of the Classic Cars column and the New Hampshire row. The circled value is the sum of all revenue from the sale of Classic Cars in New Hampshire.
|