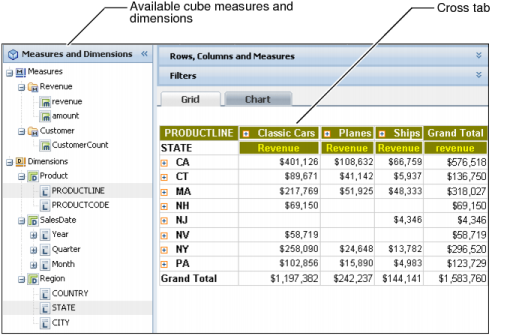
A developer uses Actuate BIRT Designer Professional to create a cube that contains data from one or more data sources. Then, the developer creates a cross tab that uses the cube data and specifies the cross tab appearance. The initial cross tab that appears in Data Analyzer typically displays a portion of the available cube data in a simple, easy-to-understand layout. Figure 1-3 shows a cross tab and all the cube measures and dimensions that are available for analysis.