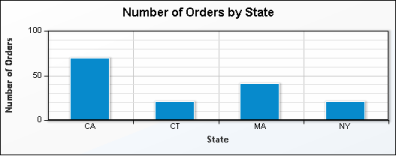
The part of a chart that contains the main chart data, typically, the most important data in the chart. Every chart uses a base chart. Some charts also include data plotted on a second y-axis. Figure G-3 shows a base chart.
|
Figure G-3
|