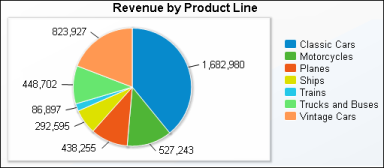
A graphic representation of data or the relationships among sets of data, for example a bar, bubble, line, meter, pie, radar, or stock chart. Figure G-7 shows a pie chart.
|
Figure G-7
|
A graphic representation of data or the relationships among sets of data, for example a bar, bubble, line, meter, pie, radar, or stock chart. Figure G-7 shows a pie chart.
|
|
|
© Copyright OpenText Corp. All rights reserved. Privacy Policy | Cookie Policy |
BIRT iHub 2 |
|