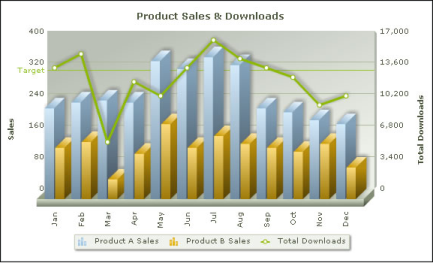
In BIRT reports, a chart that represents multiple data series as different chart types in the same plot area. In Figure G-11, for example, products A and B sales appear as vertical bars with the y-axis values on the left, and total downloads appears as a line with its y-axis values on the right.
|
Figure G-11
|