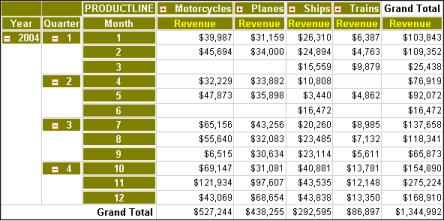
A report that arranges data into a concise summary for analysis. Data values appear in a matrix of rows and columns. Every cell in a cross tab contains an aggregate value. A cross tab shows how one item relates to another, such as monthly sales revenue totals aggregated by product line. Figure G-13 shows a cross tab.
|
Figure G-13
|