Because a chart presents a picture, it reveals trends that are not as apparent in a table. Figure 8-1 shows an example of a table and a bar chart that display sales data. The chart shows instantly the sales trend for the year.
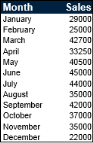
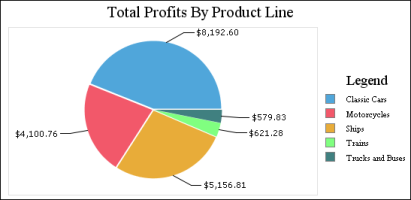
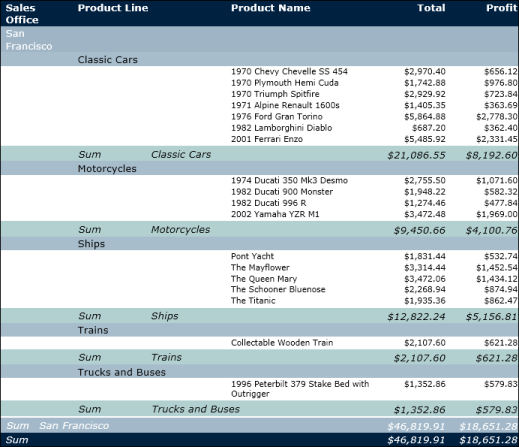
Figure 8-2 shows an example of a pie chart that displays profits by product line. The table in Figure 8-3 provides the data for the pie chart. Typically, reports display detail data in a table and summary data in a chart, especially if the detail data spans multiple pages.