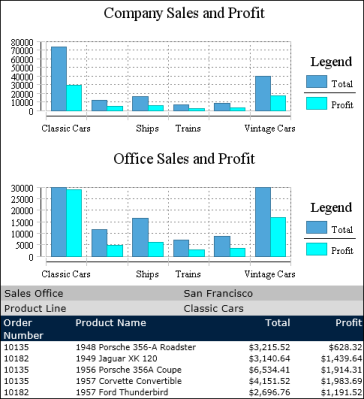
If your report design organizes data in groups instead of sections, you can create only one chart per table. Figure 8-4 shows one page of a 76-page report that displays a chart at the table level and a chart at the level of the sales office section.
If your report design organizes data in groups instead of sections, you can create only one chart per table. Figure 8-4 shows one page of a 76-page report that displays a chart at the table level and a chart at the level of the sales office section.
|
|
|
© Copyright OpenText Corp. All rights reserved. Privacy Policy | Cookie Policy |
BIRT iHub 2 |
|