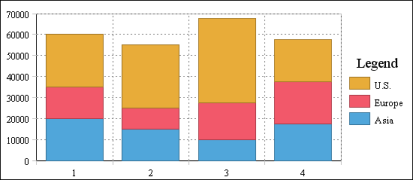
In a stacked bar chart, multiple series are stacked vertically, as shown in Figure 8-12. The stacked bar chart shows totals for each category, each quarter in this example, as well as the proportion that each series contributes to the total.
|
Figure 8-12
|