In a percent stacked bar chart, multiple series are stacked vertically, and the values are shown as a percentage of the whole. As you can see in Figure 8-13, the sales values are shown in percentages instead of the actual numbers as shown in the previous bar charts.
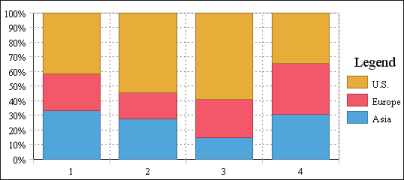
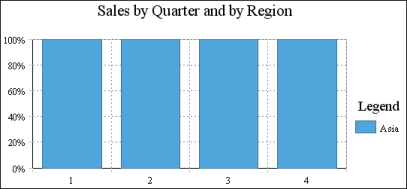
Figure 8-14 shows how a percent stacked bar chart looks when it displays only one region series. All the bars show a value of 100%, because that is the sales percentage of one region when it is compared to itself.