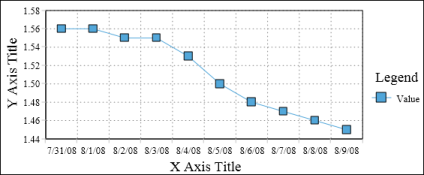
A line chart displays data values as a set of points that are connected by a line. You typically use line charts to present large amounts of data that occur over a continuous period of time. A line chart is the most basic type of chart in finance. Figure 8-16 shows an example of a line chart that shows the value of the Euro against the US Dollar over 10 days.
|
Figure 8-16
|