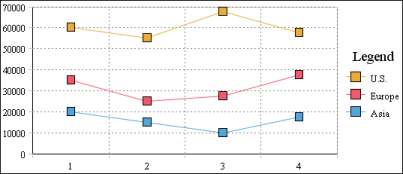
In a stacked line chart, multiple series are stacked vertically, as shown in Figure 8-18. The stacked line chart shows totals for each series, as well as the proportion that each series contributes to the grand total. In the example, the top line shows the total sales amounts for each quarter. The empty area between each line represents the sales amount for a region.
|
Figure 8-18
|