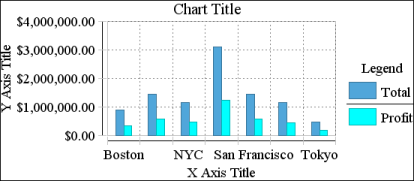
When you create a chart and use the default formatting options, the chart type and the data you select determines the basic look of the chart. The template or the software determines styles, such as fonts and colors. Figure 8-61 shows an example of a bar chart that uses default formats. You can improve the chart by editing the placeholder text for the chart title, y-axis title, and x-axis title, and by changing the size or position of the x-axis labels to display all the city labels.
|
Figure 8-61
|
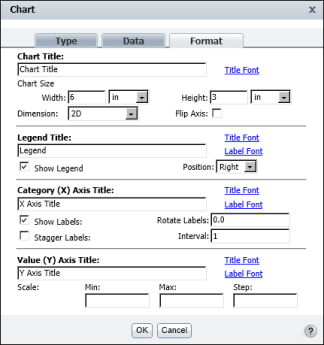
To change the appearance of a chart, change the settings on Chart—Format. Figure 8-62 shows Chart—Format displaying the default settings for a bar chart.