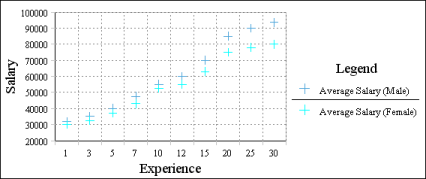
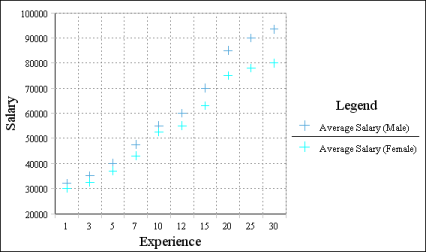
To set the height of a chart, in Chart—Format, in Chart Size, type a number in Height. When you increase or decrease a chart’s height, you increase or decrease the visual contrast between data values. Compare the charts in Figure 8-64 and Figure 8-65. Both present the same data. By changing the chart height in Figure 8-64, each chart presents a different impression of the data. The taller chart shows more contrast between the data values. If you look at the image alone you think there is a greater disparity between salaries earned by men and women than in the chart in Figure 8-64.
|
Figure 8-64
|
|
Figure 8-65
|