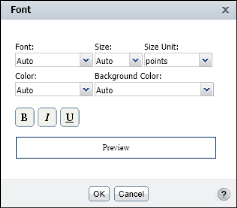
You also can change the font attributes of every title and label in the chart. To format a title, choose Title Font. To format a label, choose Label Font. Figure 8-66 shows the font attributes you can change.
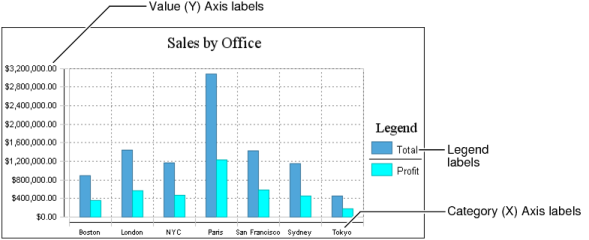
You change the font attributes of a title or labels for aesthetic reasons or for practical reasons. For example, if the x-axis does not display all the labels, as shown in Figure 8-63, reducing the font size of the Category (X) Axis labels is one way to solve the problem. Figure 8-67 shows the effect of reducing the size of the labels on the x-axis. All the city names appear.
|
Figure 8-66
|
The chart in Figure 8-67 also displays the y-axis and legend labels in a smaller size than the same labels in the chart in Figure 8-63. Typically, when you change the font attributes of labels in one area, you apply the same font attributes to labels in other areas, so that the labels in the chart have a consistent appearance.