The number and range of values on the y-axis depends on several factors, including the smallest value series value, the largest value series value, the height of the chart, and the amount of vertical space the chart items require.
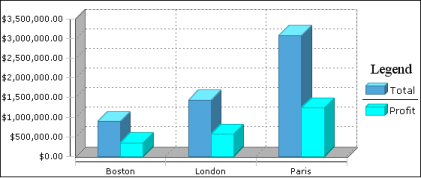
Compare the charts in Figure 8-76. Both charts present the same data, but the y-axis values are different. In the chart on the left, the y-axis displays six values, ranging from 0 to 3500000. In the chart on the right, the y-axis displays five values, ranging from 0 to 4000000. Both charts have the same height value, so in these examples, the different y-axis values are a result of the different amounts of space the x-axis labels require.
|
Figure 8-76
|
|
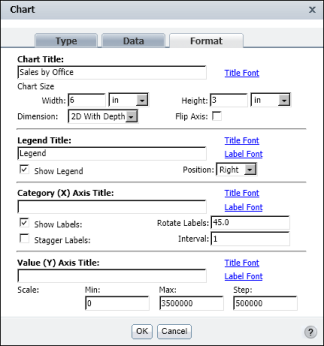
Figure 8-77
|
|
|
Min. Type a number that represents the lowest value to display on the y-axis. This number appears at the bottom of the y-axis.
|
|
|
Max. Type a number that represents the highest value to display on the y-axis. This number appears at the top of the y-axis.
|
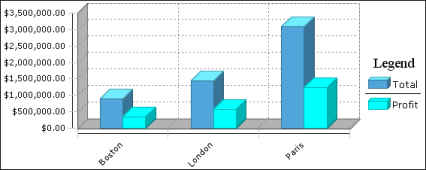
Figure 8-77 shows the Min, Max, and Step options set to 0, 3500000, and 500000, respectively. These settings change the y-axis values of the second chart in Figure 8-76 to the y-axis values in Figure 8-78.
|
Figure 8-78
|
Notice that the y-axis values in Figure 8-78 are closer together. Because the chart height is the same, the chart has to display more values in the same space. When you change the scale of y-axis values, you typically adjust the height of the chart.