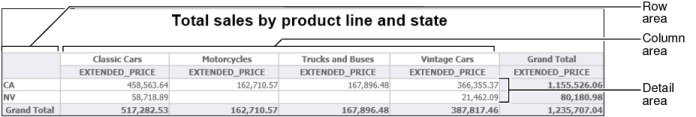
Figure 7-1 shows a cross tab that displays sales totals by state and by product line.
|
|
One field populates the column headings in the cross tab. There is one column for each unique value in the field. In the example, as shown in Figure 7-1, four unique values from the productline field—Classic Cars, Motorcycles, Trucks and Buses, and Vintage Cars—appear in an area called the column area.
|
You can use BIRT Studio to insert a cross tab in a report design, select data for the cross tab, and specify the aggregate data to display. You can also define a bookmark for a cross tab, and then create a hyperlink from another report that links to the bookmarked cross tab element. For more information on creating bookmarks and hyperlinks, see Adding interactive viewing features.