|
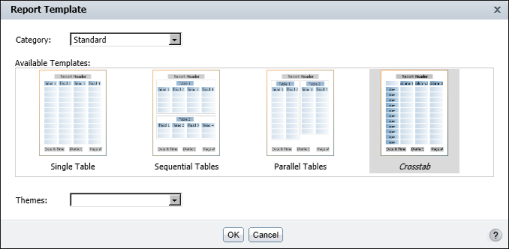
Figure 7-3
|
|
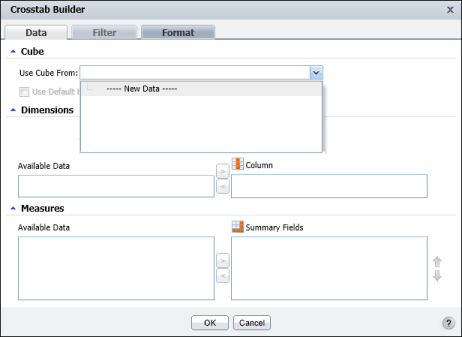
Figure 7-4
|
|
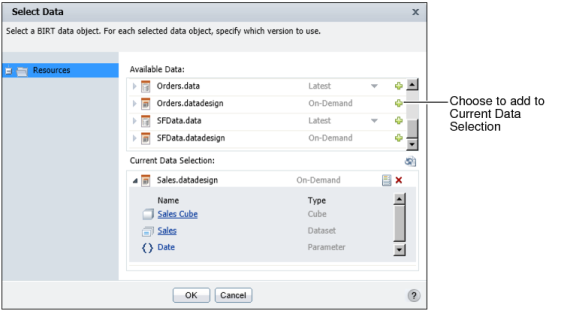
Figure 7-5
|
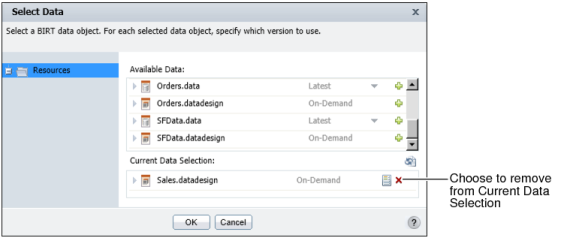
The data object appears in Current Data Selection, as shown in Figure 7-6. Choose OK. You can modify your selection by choosing Delete, as shown in Figure 7-6, and selecting a new data object in Available Data.
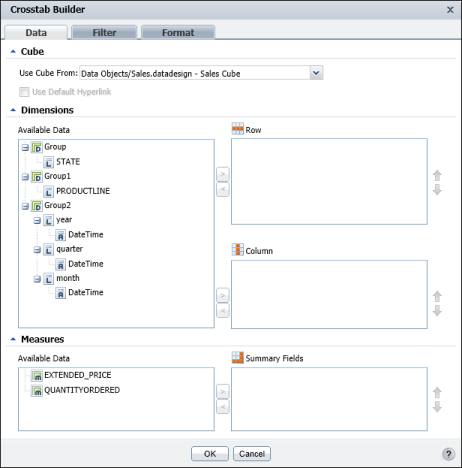
Crosstab Builder—Data displays the data from the selected data object, organized in dimensions and measures, as shown in Figure 7-7.
|
5
|
|
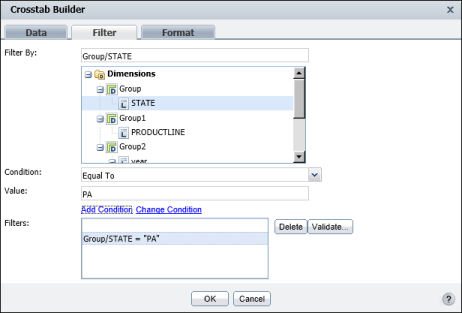
Figure 7-8
|
To create a filter at the data object level, choose Filter and specify one or more filter conditions, as you would do for a BIRT report. For example, to view data only for Pennsylvania (PA) create a filter on the state dimension, using the Equal To operator, as shown in Figure 7-8.
The cross tab displays aggregate extended price data by product line, for only the state of Pennsylvania, as shown in Figure 7-9.

|
Figure 7-9
|