|
1
|
|
3
|
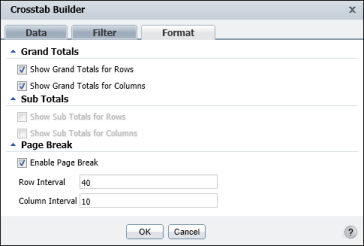
You can display subtotals for multilevel dimensions used in rows or columns. Because the example in Figure 7-10 does not contain multilevel dimensions, the Sub Totals section is not highlighted. In Sub Totals, if highlighted, do the following:
|
|
4
|
In Page Break, as shown in Figure 7-11, select Enable Page Break to specify pagination properties for the cross tab, and do the following:
|
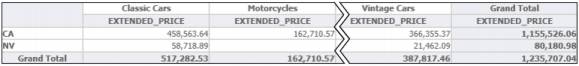
Choose OK. Sample data appears in the cross tab, displaying grand totals for rows and columns, as shown in Figure 7-12.