For a report that presents a large amount of numeric data, you might find it useful to view, for example, the top 50 order totals or the counties whose median home prices are in the bottom 10 percent. To display top or bottom values, choose Filter→Filter Top/Bottom N, then create a condition using the Top N, Top Percent, Bottom N, or Bottom Percent operators.
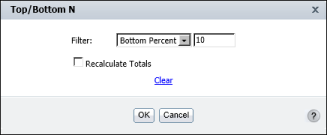
In Top/Bottom N, in Filter, select an operator, then specify a value in the next field, as shown in Figure 5-6. If you are filtering a detail table containing aggregate data, or a summary table, to recalculate the aggregate data values for the retrieved data rows, accept the default selection of Recalculate Totals. To display aggregate data values for the unfiltered data in the report table, deselect Recalculate Totals.
|
Figure 5-6
|
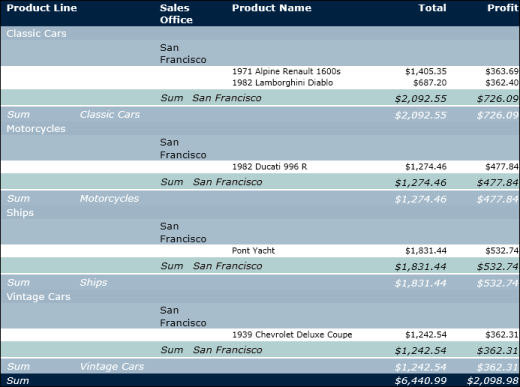
Choose OK. The report design displays the data rows that match the filter condition you defined, as shown in Figure 5-7.
To modify the filter condition you just created, because the filter is created at the group level, use the Top/Bottom N dialog box to change the condition. To modify a top or bottom filter created at the report table level, you can either use the Top/Bottom N dialog box or the Advanced Filter dialog box. For information about using the Advanced Filter dialog box to perform this task, see Changing a condition.