|
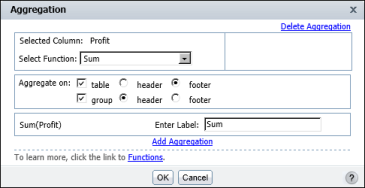
Figure 4-24
|
|
6
|
If you want to calculate and display a second aggregation, choose Add Aggregation. Follow steps 4 to 5 to define the next aggregation.
|
|
7
|
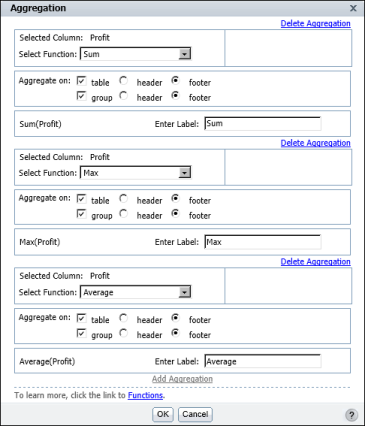
Choose OK. Figure 4-25 shows the three aggregations that are defined for the report design in Figure 4-23.
|
|
Figure 4-25
|