Lengthy reports or reports that consist of distinct sections typically look more organized if each section appears on a separate page. The product profitability report design example appears compact, because it is previewed with a small number of rows. For example, the report design in Figure 4-29 is set to display only 20 rows of data. When the report is run and appears in the viewer, it contains 60 pages of data.
As you design a report, make sure you periodically view the generated report to see if you need to set page breaks to make the report more usable. You can set a page break for each group and section you create. In the report design in Figure 4-29, you can start each sales office section and each product line group within the sales office section on a new page.
|
1
|
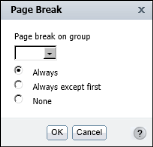
Select a grouped column or section heading. Right-click the object, then choose Group→Page Break or Section→Page Break. Page Break appears, as shown in Figure 4-35.
|
|
Figure 4-35
|