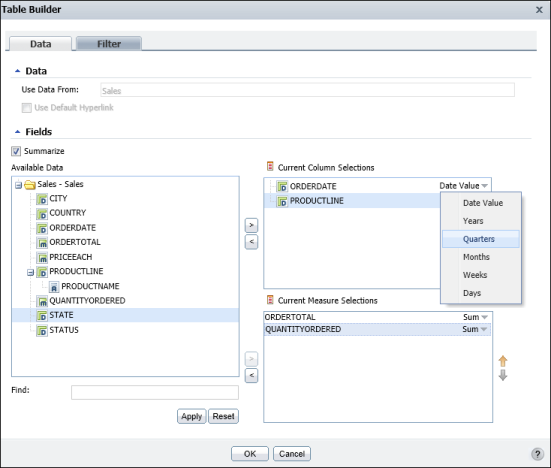
The selected data fields, Order Date and Product Name, appear in Current Column Selections, as shown in Figure 6-4. The selected measure fields, Order Total and Quantity Ordered, appear in Current Measure Selections. Use the arrows to modify the order in which you want the selected fields to appear in the report design.
|
4
|
For each selected dimension field containing date-and-time data, you can group the data in intervals. Select an available interval from the Date Value drop-down list. Figure 6-4 shows the Order Date field grouped in quarters.
|
|
2
|
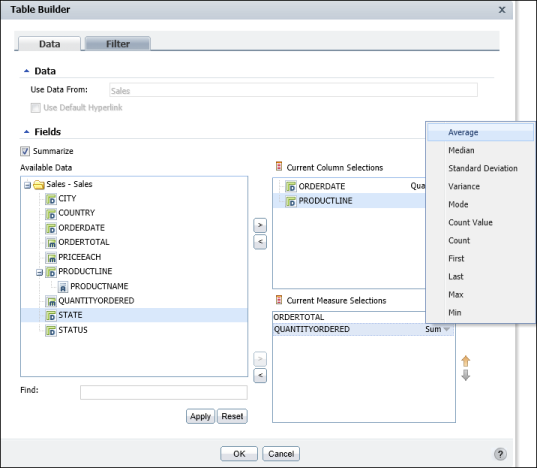
Use the menu to choose a new aggregate function to apply to the field. Figure 6-5 shows the average function applied to the Quantity Ordered field.
|
|
Figure 6-5
|
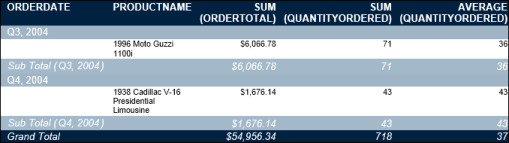
Choose OK. BIRT Studio displays the selected data fields in a summary table, as shown in Figure 6-6. You are now ready to modify the summary table.
|
Figure 6-6
|