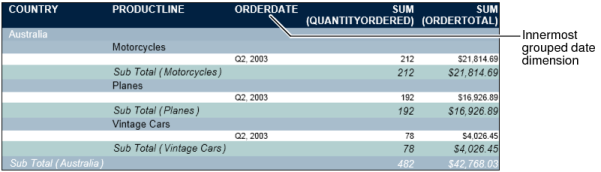
A grouped dimension column displays subtotals for the data in each group. When you group a dimension column, BIRT Studio eliminates duplicate data values when calculating aggregate data. Figure 6-9 displays a summary table containing three dimension columns. The Order Date column is grouped in quarterly intervals, and is located in the innermost position.
When a summary table contains more than one dimension column, data in the outer dimension columns can be grouped, as shown in Figure 6-9, and subtotals are displayed for each value in the grouped column.
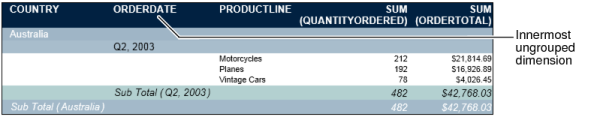
When working with a dimension column that contains date-and-time data, you can group the data by intervals such as day, week, month, quarter, or year. When placed in the innermost position, dimension columns that contain other types of data cannot be grouped, as shown in Figure 6-10. If a dimension column contains date-and-time data, you can always group data in the column by intervals.
|
Figure 6-10
|
The innermost dimension column does not display subtotals, irrespective of the type of data in the column, as shown in Figure 6-9 and Figure 6-10.
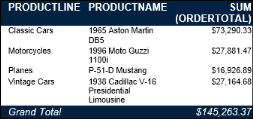
For a summary table containing a single dimension column, and one or more associated attribute columns, you cannot group data in the dimension column. No subtotals appear. The summary table displays a grand total value for all product lines, as shown in Figure 6-11.
|
Figure 6-11
|
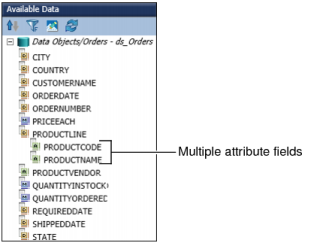
The preceding summary table results from the data object, as shown in Figure 6-12, which contains the Product Line dimension and two associated attribute fields, Product Code and Product Name.