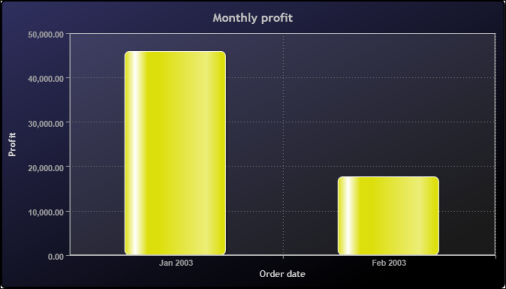
The charts shown in the following examples in Figure 8-93 and Figure 8-94 display two of several themes available in BIRT Studio. Using a theme provides a consistent style across different types of charts. For example, a theme that uses corporate styles might define general attributes, such as color schemes for the chart background and plot areas, font styles for chart titles, value labels, or axis labels, border styles, and legend styles.
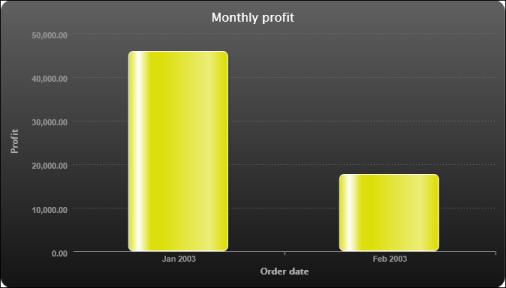
Themes are designed by the report developer, who then makes them available to users. Figure 8-93 shows a chart that uses the Chart Blue theme, while Figure 8-94 shows the same chart using the Chart Gray theme. The chart in the example in Figure 8-92 uses the Chart Grid theme.
|
Figure 8-93
|
|
Figure 8-94
|
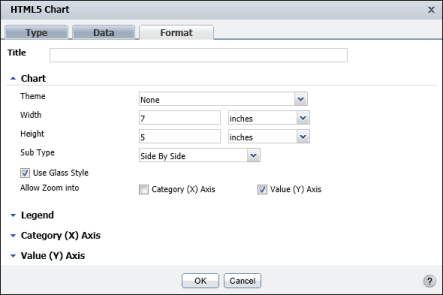
In the example shown in Figure 8-95, the Format page displays the option to zoom into a region on the Value (Y) axis.
|
Figure 8-95
|
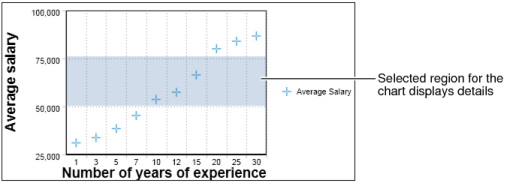
On the chart, use your mouse pointer to select the region on the Value (Y) axis for which you want to view details. The example in Figure 8-96 shows a selected region on the y-axis. BIRT Studio displays detailed data in the chart, for the selected section. To view the entire chart once again, select Reset Zoom, which appears on the top right corner of the chart.
|
Figure 8-96
|