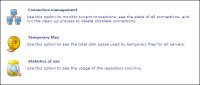
The Monitoring use module allows the administrator to manage a connection, track disk usage for temporary files, and monitor use of the BIRT Analytics tool on database objects, as shown in Figure 1‑40.
Figure 1‑40 BIRT Analytics monitoring options
The module contains the following options:
Connection management
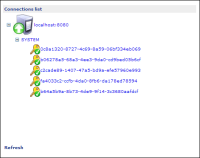
Monitors the state of existing servers and connections, and run the clean-up process to delete obsolete connections, as shown in Figure 1‑41. The server and connection icons indicate whether a component is functioning and available. Choose Refresh to update connection information.
Figure 1‑41 Viewing monitoring servers and connections
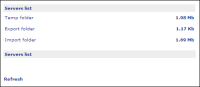
Temporary files
Provides the following information on the disk space used by temporary files on all servers, as shown in Figure 1‑42:
Temp folder
File space used for analytical calculations
Export folder
File space used during data export operations
Import folder
File space used during data import operations
Choose Refresh to update temporary file information.
Figure 1‑42 Viewing temporary files server and folder lists
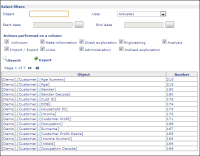
Statistics of use
Provides information on data column use. The administrator can use these statistics to analyze what data columns have the highest and lowest access rates to optimize data queries. This module provides the following filters, as shown in Figure 1‑43:
Object
Searches only for actions performed on columns in which the object name coincides partially with the value inserted in this field
User
Searches only for actions performed on columns by the specified user
Start and End dates
Limits search to specified date range
Actions done over columns
Searches only for actions selected in the following category list:
Unknown
Meta-information
Direct exploration
Engineering
Analysis
Import/Export
Links
Administration
Indirect exploration
Choose Search to generate the statistics, displaying the object name and number of times the data has been accessed during the specified time range.
Choose Export to download the statistics to a comma-separated values (CSV) file.
The results of a query are shown in a page format listing 15 items per page. The results are sorted using the following criteria, as shown in Figure 1‑43:
Descending order based on the number of actions performed on a column