A correlation measures the dependence relationship between two or more continuous sets of data. Once a domain segment is provided, BIRT Analytics calculates the distinct correlation coefficients (using Pearson’s correlation coefficient) between all the possible combinations of pairs of sets of data.You must use continuous variables because this correlation coefficient needs this kind of data to run all its calculations.
Understanding the correlation matrix
A correlation matrix tabulates the results of the correlation coefficient between pairs of variables provided. Each cell shows the correlation coefficient for a certain combination of column and row.Each row and column represents the distinct continuous sets of data compared.
The value of the Pearson’s correlation coefficient goes from -1 to 1. Results near to 1 indicate a direct dependency. If one value grows so does the other. Results are close to -1 indicate a decreasing linear dependency, also known as anti-correlation. Values approaching zero indicate that the data sets are “uncorrelated”.
How to create a correlation matrix
1 In Analytics—Advanced, choose Correlations.
2 In the Parameters tab, drag the desired database table and drop it in the Domain field.
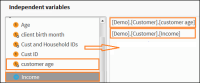
3 In the Independent variables pane, expand the database and the appropriate tables.
4 Drag and drop the appropriate columns (specifying the continuous variables for your correlation calculations) from the left pane into the right pane and click on Train. (See Figure 6‑21 below).
Figure 6‑21 Correlations - Parameters tab
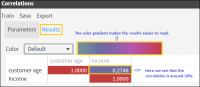
5 A correlation matrix automatically appears in the Results tab below, as shown in .Figure 6‑22