The Monitoring use pages allow the administrator to manage a connection, track disk usage for temporary files, and monitor use of the BIRT Analytics tool on database objects,.
BIRT Analytics Administration provides the following system configuration pages:
Connection management
View the connections to the FastDB database used by BIRT Analytics.
Temporary files
View the temporary file storage on disk used by BIRT Analytics.
Statistics of use
View the usage of database fields by BIRT Analytics users.
Managing connections
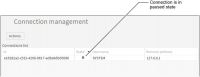
The Connection management page allows the administrator to monitor the state of servers and connections, as shown in Figure 1‑24. The server and connection icons indicate whether a component is running or paused.
Click Actions and choose Refresh to update the connection information.
Figure 1‑24 Viewing monitoring servers and connections
Viewing temporary file usage
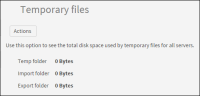
The Temporary files page provides the following information on the disk space used by temporary files on all servers, as shown in Figure 1‑25:
Temp folder
File space used for analytical calculations
Import folder
File space used during data import operations
Export folder
File space used during data export operations
Figure 1‑25 Viewing temporary files server and folder lists
Click Actions and choose Refresh to update temporary file information.
Viewing usage statistics
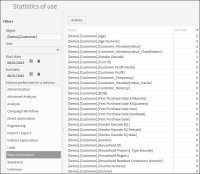
The Statistics of use page provides information on data column use. The administrator can use these statistics to determine which data columns have the highest and lowest access rates and use that information to optimize data queries. This page provides the following filters, as shown in Figure 1‑26:
Object
Searches only for actions performed on columns in which the object name contains the value in this field
User
Searches only for actions performed by the specified user
Start and End dates
Limits search to specified date range
Actions performed on a column
Searches only for actions selected in the following category list:
Administration
Advanced Analysis
Analysis
Campaign Workflow
Direct exploration
Engineering
Import/Export
Indirect exploration
Links
Meta-information
Selections
Unknown
Choose Search to generate the statistics, displaying the object name and number of times the data has been accessed during the specified time range.
Choose Export to download the statistics to a comma-separated values (CSV) file.
The results of a query are sorted using the following conditions, as shown in Figure 1‑26:
Descending order of the actions performed on a column