Association rules find patterns in very large amounts of point-of-sale data. An association rule is of the form “If a shopper purchases Item A and Item B, the shopper also purchases Item C.” For example, association rules can indicate that if a shopper buys onions and potatoes on a trip to the supermarket, they are likely also to buy hamburger meat. Such information can be used as the basis for decisions about marketing activities, such as promotional pricing and product placements.
To identify association rules, you must provide the transaction ID and the transaction items for a very large number of purchases. The Transaction Id and Transaction Item columns must belong to the same database table. You must also provide values for Minimum Support and Minimum Confidence:
Minimum Support is the minimum percentage of transactions that must contain all the items in the rule. It is set to 10%.
Support (A,B) = Transactions (A,B)/Total transactions
Minimum Confidence measures how well a rule predicts the right-hand side after the “then” clause of the rule (If A,B then C) by comparing how often the right-hand side (consequent) appears when the condition on the left-hand side (antecedent) is met. This is set to 65%.
Confidence (A,B-> C) = Support (A,B,C)/Support (A,B)
Use the default values for Minimum Support and Minimum Confidence for the first trial. Depending on the results, you can increase or decrease these values.
Optional parameters include:
Filter: You can define a domain to restrict the transactions used in the trial.
Antecedent Item Range: Minimum and maximum number of items that the left-hand side of the rule must contain.
Filter for the antecedent items.
Consequent Item Range: Minimum and maximum number of items that the right-hand side of the rule must contain.
Filter for the consequent items.
The results of a trial are displayed in a table. The antecedent and consequent items appear in the first two columns. There are also several numeric columns that measure how well the rule predicts the consequent. The columns that appear in the Results tab are:
Antecedent: Items on the left-hand side of the rule.
Consequent: Items on the right-hand side of the rule.
Support (%): Measures the percentage of transactions that contain all the items in the rule.
Confidence (%): Measures how well the rule predicts the consequent by determining how often the consequent appears when the condition of the antecedent is met.
Lift: Also called improvement. Measures how well the rule predicts the consequent. A lift greater than one indicates that the items in the rule appear together more than expected.
Leverage: Measures how well the rule predicts the consequent. The calculation method is different from lift, but the purpose is the same.
Opportunity: A star indicates that the lift is greater than one.
Items in the antecedent and consequent are enclosed in double quotation marks and separated by a comma. Numeric rule measures such as support, confidence, and lift are rounded to two decimal places.
How to find association rules
1 In Analytics—Advanced, choose Association Rules.
2 Drag the appropriate column from My Data and drop it in Column in Transaction ID.
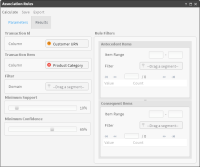
3 Drag the appropriate column from My Data and drop it in Column in Transaction Item. Accept the default values for Minimum Support and Minimum Confidence, as shown in Figure 6‑17.
Figure 6‑17 Default values for Minimum Support and Minimum Confidence
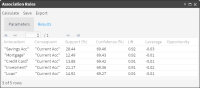
4 Choose Calculate. The association rules appear in the Results tab, as shown in Figure 6‑18.
Figure 6‑18 Results using default values for Minimum Support and Minimum Confidence
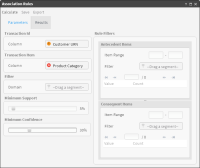
5 If the default values for Minimum Support and Minimum Confidence do not yield many opportunities, choose Parameters and decrease these values. In Figure 6‑19, Minimum Support and Minimum Confidence are decreased to 5% and 30%, respectively.
Figure 6‑19 Decreasing the values for Minimum Support and Minimum Confidence
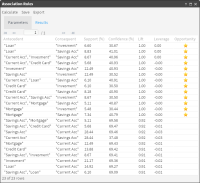
6 Choose Calculate. The association rules appear in the Results tab, as shown in Figure 6‑20. Decreasing the values for Minimum Support and Minimum Confidence yields several opportunities, indicated by a gold star.
Figure 6‑20 Results using decreased values for Minimum Support and Minimum Confidence