Data Explorer is a tool that displays detailed and summary information about databases, tables, and fields. To access Data Explorer, choose Explore. Next, drag a segment from Data Tree or Scratchpad, and drop it in Record View.
Depending on the selection you make, different views are available, as shown in Table 2‑4.
Table 2‑4 Data Explorer views for data selection types
Selection type
Available Data Explorer view
Database
Summary
Table
Record, Summary
Unindexed field
Record, Summary
Indexed textual field
Record, Summary, Discrete Values, Chart
Indexed numeric field
Record, Summary, Discrete Values, Chart, Statistics, Frequency
Data Explorer enables you to export data as .csv files which can be opened in Microsoft Excel. To remove data from Data Explorer, choose Clear.
About Record View
Record View displays the records in the table you are exploring or the table that contains the field you are exploring. For example, when you explore the Customers table you see 50 of the 259,874 records. You can browse the pages into which the records are divided by using the arrows on the pagination bar. You can navigate to a specific page by typing the page number and pressing Enter.
Select the specific columns/fields you want to view exclusively in the Data Explorer main window by clicking on the small “Column Selector” icon in the upper right-hand corner of the window.
Double-clicking on a column/field in the Data Tree moves it into the main Data Explorer window on the right.
You can remove columns from the main Data Explorer panel by dragging them out.
To remove all data from the Data Explorer, click on “Clear”.
About Summary
Summary displays information about the database, table, or field you are exploring.
For a database, Summary displays the name of the database; the tables in the database; and the rows, columns, and cells in each table.
For a table, Summary displays the name of the table; the number of rows, columns, and cells it contains; other database tables to which it is joined; and information about each field in the table, such as data type, discrete values, and whether or not the column is indexed.
For a field, Summary displays the name field; the table containing it; and other information, such as data type, number of discrete values, and whether the column is indexed.
To export the contents of the Summary to a PDF file, choose the export icon in the upper‑right corner.
About Discrete Values
Discrete Values shows the categories in a column, the occurrences or records for each category, and the percentage for each category. To export the contents of Discrete Values to a CSV file, choose Export. CSV format is compatible with Microsoft Excel and text editors, such as Ultraedit and Notepad++.
About Chart
Chart displays a graphical representation of the records of categories in a database column. The values are ordered from most frequently occurring to least frequently occurring. The following chart types are supported:
Columns 3D (default)
Areas
Bars
Columns
Doughnut
Doughnut 3D
Lines
Pie
Pie 3D
To change the chart type, use the “chart” icon in the upper right corner.
To export a chart as an image file, choose the “image” icon.
The export icon displayed in the Chart view exports the full analysis (data and graphic) in PDF format.
Sorting Charts in Explorer
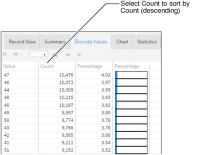
By default, and for performance reasons, the Chart view displays records sorted by Value (ascending). This default sort is determined by how the values are sorted in the Discrete Values view. To display your Chart sorted by Count (descending) instead of by Value (ascending), you need to go to the Discrete Values view and select Count. Your Chart then appears by Count (descending), as shown in Figure 2‑7.
Figure 2‑7 Sorting Charts in Explorer
About Statistics
Statistics displays the following information in a tabular format for numeric fields.
Table 2‑5 Information provided for a numeric field
Column name
Value displayed
Count
Total number of non-discrete values in the field.
Kurtosis
A measure of the distribution of values, or peakedness. The value varies between -0.5 and 0.5. The Kurtosis coefficient indicates how sharp a distribution is, relative to a standard normal distribution.
Maximum
Largest value in the field.
Mean
Arithmetic average of all non-discrete values in the field.
Median
Value for which there are an equal number of larger values and smaller values in the field.
Minimum
Lowest value in the field.
Mode
The most frequently occurring value in the field.
Skewness
A measure of symmetry that varies between -0.5 and 0.5. If skewness is negative, the distribution is skewed to the left. If skewness is positive, the distribution is skewed to the right.
Standard deviation
A measure of how much variation or dispersion there is from the mean. A low standard deviation indicates that the data points tend to be very close to the mean. A high standard deviation indicates that the data points are spread over a large range of values.
Sum
The sum of all the values in the field.
Sum of squares
The sum of all the squared values.
To export the contents of the Statistics tab to a PDF file, choose the export icon in the upper‑right corner.
About Frequency
Frequency displays a graphical representation of the occurrences of values in a database column. The values are in ascending order. The following chart types are supported:
Areas (default)
Bars
Columns
Columns 3D
Lines
To change the chart type, use the chart icon in the upper‑right corner. To export a chart to a JPG file, choose the export icon.
Exploring views of a database
Data Explorer supports viewing different levels of a database, depending on the level of data you choose to view. For example, you can choose a database to view summary information for that database. You can choose a column in a database table to view records, discrete values, a chart of values, or summary information about the column.
Note: When you minimize the size of a window, an icon appears that lists any buttons or tabs that are no longer accessible on the screen.
How to view a database summary
1 Drag a database from My Data and drop it in Data Explorer.
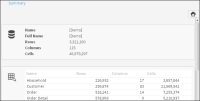
2 Examine the information appearing on Summary, as shown in Figure 2‑8.
Figure 2‑8 Viewing a database summary in Data Explorer
How to view a database table
1 From a database appearing in My Data, drag a table and drop it in Data Explorer.
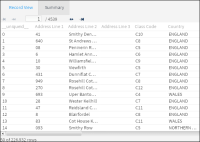
2 Examine the information on Record View and Summary, as shown in Figure 2‑9.
Figure 2‑9 Viewing records from a table in Data Explorer
How to view a database column
1 From a database table appearing in My Data, drag a column and drop it in Data Explorer.
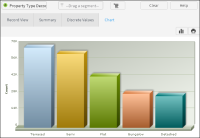
2 Examine the information in Record View, Summary, Discrete Values, and Chart, as shown in Figure 2‑10.
Figure 2‑10 Viewing a database column using a chart in Data Explorer
Filtering views of a database
You can filter the view of a table or column appearing in Data Explorer using segments. Adding a segment to the view of a table or column limits the records shown to only those records having a value that matches the segment.
How to filter a database view using a segment
1 Drag a column from My Data and drop it in Data Explorer.
2 Select Discrete Values.
3 Drag a row in Discrete Values and drop it in Scratchpad. For example, from the Age Numeric column, drag Age Numeric EQ 25 under. A segment appears in Scratchpad.
4 In Data Explorer, select Record View.
5 Drag one or multiple segments from Scratchpad and drop the segments in Drag a segment. A view of data, filtered by the selected segment, appears in Data Explorer.