A profile analysis groups values and determines their relatedness to another group, called the profile segment. This analysis helps you draw a profile of a group of values from attributes selected in Data Tree.
In advertising, a target group refers to the people to whom the advertising is directed. The target group is like a profile segment. If a profile segment is chosen, the profile carries out a comparison with each of the attributes that are selected based on all the database’s values, including the analysis segment itself. In other words, a request is made for an analysis of the significance of the attributes to define the segment, instead of all other values in the database.
Alternatively, if a base segment is selected in addition to the profile segment, the analysis is based on the values that are part of that chosen segment. In the first case the segment is defined. In the second case, whether the attributes are suitable for showing differences between both groups (profile and base segment) is defined. Three different scenarios are possible:
Customers who provide higher profits vs. customers who provide lower profits (no overlapping of values).
Customers who have responded to a campaign via e‑mail vs. all who have responded (the segment to be profiled is part of the base).
Customers who have bought product X this year vs. customers who bought product X last year. There are some values that are part of both segments, profile and base, but not all.
There are several indicators that measure the significance of the attributes to define the analysis segment, including Z-score. The Z-score determines whether the difference between two proportions is statistically significant. In the case of profile, this determination is carried out between the group to be analyzed and the group considered Rest, values that belong to the attribute whose significance you want to measure but not to the analysis segment.
The Z-score uses the binomial for unequal variances, whose formula is:
Z = (p1-p2)/sqrt((p1*(1-p1)/n1 + (p2*(1-p2)/n2))
p1 is the sampled proportion and n1 is the number of sampled values.
p2 is the proportion in Rest and n2 is the number of Rest values. Table 4‑2 shows calculated Z‑scores.
Table 4‑2 Calculating Z-scores
Men
Rest
Z-score
M
34.4%
19.0%
171.31
X
27.9%
16.6%
132.66
W
17.0%
9.8%
102.52
S
20.7%
54.6%
-336.01
682,493
317,507
In other words:
You would first choose the characteristics or attributes whose significance you want to measure to determine the analysis segment.
Significance means those attributes or characteristics that meet the highest possible number of cases in the segment analyzed.
You set the characteristics or attributes of those whose significance you want to measure to define or characterize the analyzed segment:
How is this significance measured?
Using a Z-score indicator.
This indicator is obtained by applying a statistical formula.
The higher the Z-score of the attribute, the higher the defining capacity, or relatedness, of the segment analyzed.
A Z-score higher than 0 can be considered significant to describe a segment, but values below 1.96 cannot be considered statistically significant. Only values above this threshold can be considered significant. You set attributes to measure the significance, which means that other values that are not chosen for the study may be the ones that are truly statistically significant to define the analysis segment.
How to create a Profile analysis
1 In Analytics—Analysis, choose Profile.
2 In Profile, choose Advanced.
3 To create a segment, drag one or more values from Discrete Values to Scratchpad. Alternatively, use an existing segment. The segment of data represents a profile group against which you test the significance of various attributes.
4 If necessary, rename the segment appropriately.
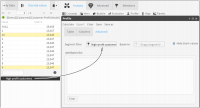
5 Drag the segment from Discrete Values and drop it in Segment filter, as shown in .
Figure 4‑114 Adding a segment filter
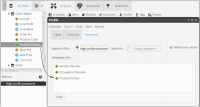
6 Drag fields from Data Tree into Attributes list, as shown below. Using the Profile analysis, you test these attributes for how significantly they contribute to the profile, as shown in Figure 4‑115.
Figure 4‑115 Adding profile attributes
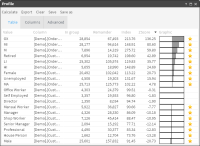
7 Choose Calculate.
8 Examine the results on Table. The gray bars in the Graphic column show which discrete values from the list of attributes contribute most significantly to the profile, as shown in Figure 4-79. Note: the gray bars represent the Z-score, and the column is sorted from most significant to least significant.