A Venn diagram provides an analysis of data by crossing different fields. A Venn analysis identifies coincidences and differences between N segments. Up to five different segments appear on the graphic display in Chart.
On Advanced, in addition to the resolution table, you can set Filter and Format.
Filter
You can include a filter at the analysis level, which means that a Venn diagram can be constrained to show results for a specific and smaller universe. For example, include the customers who have purchased one, two, or three product types, but only in Madrid.
Format
You can format your results to show a count of values that match the condition you selected, a percentage of the total number of records included the analysis, or a global percentage, which means that each percentage is based on the total possible records from the resolution table being analyzed.
01 How to create a Venn diagram analysis
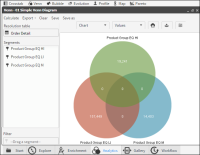
1 Drag a segment from Discrete Values or from Scratchpad and drop it in Chart in Venn, as shown in Figure 4‑88 below.
2 Drag additional segments to Chart, up to a maximum of five. The Venn diagram is drawn as you drop each item into Chart.
For example, to identify cross-selling opportunities, examine customers who have purchased different categories of products.
Figure 4‑88 Dragging a discrete value to a Venn analysis
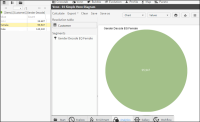
3 Using the Venn analysis, cross the data segments representing three different product categories. Zero coincidences occur, because a product is of one type or another, but not both, as shown in Figure 4‑89.
Figure 4‑89 Showing three discrete values with no coincidences
02 How to change the resolution of a Venn diagram analysis
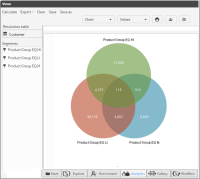
A Venn diagram can show coincidences or differences at other levels of database resolution. For example, resolving the Venn diagram at the customer level shows coincidences between the two or three segments, including customers purchasing one, two, or three products.
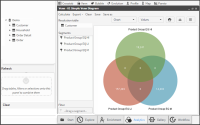
1 Change the resolution by dragging a different table to Resolution Table, as shown in Figure 4‑90.
Figure 4‑90 Changing the Venn diagram’s resolution
2 Choose Calculate to redraw the chart after changes. The resulting chart is shown in Figure 4‑91.
Figure 4‑91 Showing a Venn diagram with a changed resolution table