A correlation measures the dependence relationship between two or more continuous sets of data. Once a domain segment is provided, BIRT Analytics calculates the distinct correlation coefficients (using Pearson’s correlation coefficient) between all the possible combinations of pairs of sets of data.You must use continuous variables because this correlation coefficient needs this kind of data to run all its calculations.
Understanding the correlation matrix
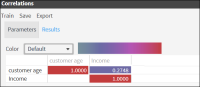
A correlation matrix tabulates the results of the correlation coefficient between pairs of variables provided. Each cell shows the correlation coefficient for a certain combination of column and row.Each row and column represents the distinct continuous sets of data compared.
The value of the Pearson’s correlation coefficient goes from -1 to 1. Results near to 1 indicate a direct dependency. If one value grows so does the other. Results are close to -1 indicate a decreasing linear dependency, also known as anti-correlation. Values approaching zero indicate that the data sets are “uncorrelated”.
How to create a correlation matrix
1 In Analytics—Advanced, choose Correlations.
2 In the Parameters tab, drag the desired database table and drop it in the Domain field.
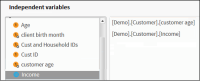
3 In the Independent variables pane, expand the database and the appropriate tables.
4 Drag and drop the appropriate columns (specifying the continuous variables for your correlation calculations) from the left pane into the right pane and select Train, as shown in Figure 6‑21.
Figure 6‑21 Correlations - Parameters tab
A correlation matrix automatically appears in the Results tab, as shown in Figure 6‑22.
Figure 6‑22 Correlations - Results tab
Understanding the difference between correlation and linear regression
Correlation and Linear Regression are often used together but they are not the same.
Correlation quantifies the degree to which two variables (X and Y) are related. It can be computed and interpreted for any two variables. It does not fit a line through the data points. It involves computing a correlation coefficient (r) that tells you how much one variable tends to change when the other one changes.
Linear regression finds the best line that predicts Y from X. It is usually used when X is a variable you manipulate (time, concentration, etc.)
With correlation you do not have to think about cause and effect. It does not matter which of the two variables you call “X” and which of the variables you call “Y”. You get the same correlation coefficient if you swap the two.
The decision of which variable you call “X” and which you call “Y” matters in regression. You will get a different best-fit line if you swap the two. In other words, the line that best predicts Y from X is not the same as the line that predicts X from Y (even though both lines will have the same value for r2).
In correlation both X and Y are measured. With linear regression, the X values can be measured or can be a variable controlled by the user.
Relationship between results
Correlation:
computes the value of the Pearson correlation coefficient - r