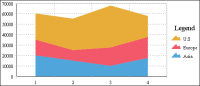
A stacked area chart consists of multiple series stacked vertically, as shown in
Figure 8‑7. The example shows that the stacked area chart is suitable for the data because the chart displays totals for all series as well as the proportion that each series contributes to the total. The height of the top line shows the total value for each category, for each quarter in this example. Each shaded area represents the sales amount for a specific region.