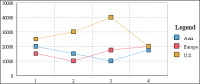
In an overlay line chart, multiple series appear as overlapping lines, as shown in
Figure 8‑12. The squares mark each data value. Overlay line charts show lines from each series independent of the others. The lines appear joining the values for the series.