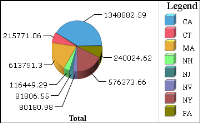
Pie charts show values as slices of a pie. The size of each slice is proportional to the value it represents. You plot pie charts for multiple series as multiple pies, one for each series. You use a pie chart to show the relationship of parts to the whole. For example,
Figure 8‑15 shows the contribution of each state to the total sales of a product.