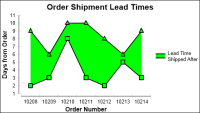
A difference chart typically shows variation between two sets of data by shading the areas between points of comparison. You use a difference chart when you want to use shading and multiple graphs to accentuate the deviation between data variables. The chart shown in
Figure 8‑23 displays the lead time between the shipped date and the required date from the order date.