Selecting a legend item to hide specific Flash chart data
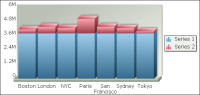
If a Flash chart contains more than one value series, you can also use the legend of the chart to toggle between the series. For example, in
Figure 8‑52, from the legend, select Series 1 to hide profit values in the chart.
Figure 8‑52 Selecting a legend value
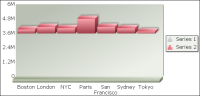
The chart now displays revenue by sales office only, as shown in
Figure 8‑53. This option provides a quick view of the data for each series.
To redisplay profit values in the Flash chart, select Series 1 in the legend. The Flash chart displays both sets of values.
Figure 8‑53 Chart displaying revenue by sales office