How to export a report or report element to Excel
1 To export a report, or report element, such as a cross tab, or a chart, choose Export Content from the main menu, as shown in
Figure 4‑9. Export Content appears.
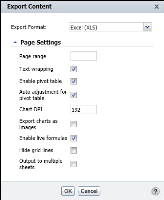
2 On Export Content in Export Format, select Excel, as shown in
Figure 4‑10.
3 Select Page Settings. In Page Settings, provide the following information:
1 Select the page range, or specify the page numbers that you want to export.
2 Select Text wrapping to eliminate the need for horizontal scrolling in the exported report.
3 Select Enable pivot table to export the report as a pivot table, to facilitate data analysis in Excel.
4 Select Auto adjustment for pivot table, to enable the BIRT Viewers to automatically adjust the content for display in a pivot table.
5 If exporting a regular BIRT chart:
1 Specify the DPI at which the chart is exported. If you do not specify a value, the BIRT Viewers export the chart at 192 DPI.
2 To export each chart as an image, select this option.
6 Select Enable live formulas, to export live formulas when exporting content from a BIRT report that contains expressions created using EasyScript.
7 Select Hide grid lines.
8 To export the output to multiple sheets, select this option.
Choose OK.
Figure 4‑9 Exporting a report
Figure 4‑10 Exporting content to Excel
4 File Download appears. The default name assigned to the file and file extension are visible. Choose Open or Save.
When you open the file, the report displays in Excel, and can be edited as needed.

