Displaying aggregate data
A key feature in a cross tab is the ability to display aggregate data. For example, a sales cross tab can show the average sales figures, the highest and lowest sales figures, the number of reported sales, the overall sales total, or sales subtotals by product type, region, sales representatives, or time period.
Data Analyzer supports displaying column and row totals and group subtotals as aggregate data values. For example,
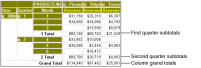
Figure 4‑1 displays the following aggregate data values in the Planes, Ships, and Trains columns:

The revenue sum for each numbered month
The first-quarter and second-quarter revenue subtotals, labeled 1 Total and 2 Total, respectively
The total revenue sum for each column, labeled Grand Total
You can display the grand totals and subtotals on columns and rows either before or after the detail values.
Figure 4‑1 Displaying subtotals
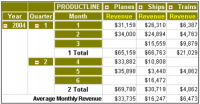
Figure 4‑2 shows average-monthly-revenue aggregate values in the bottom row of the cross tab. These values represent the averages of the monthly revenue values for each of the product lines as they appear in the cross tab.
Figure 4‑2 Displaying subtotals and averages
Data Analyzer supports an option to aggregate values, based on the visible cross tab values or on the detail rows values in the data source.
Figure 4‑3 displays an example of aggregate values based on visible cross tab values. Each cell in the row labelled 1 Total displays an aggregate value, count, which equals the number of revenue values that are visible in each product line column for the first quarter of 2004. The last cross tab row labelled First Quarter Average Sales per Month displays an aggregate value, average, which equals the sum of the revenue values in the column divided by the count value in the 1 Total row.
Figure 4‑3 Displaying visible values counts and averages
Figure 4‑4 displays an example of aggregate values based on detail rows values in a data source. In the data source, each revenue value represents sales revenue from one order. Each cell in the row labelled 1 Total displays an aggregate value, count, which equals the number of revenue values in the data source in each column for the first quarter of 2004. The last cross tab row labelled First Quarter Average Sales Amount displays an aggregate value, average, which equals the sum of the revenue values in the column divided by the count value in the 1 Total row.
Figure 4‑4 Displaying data source counts and averages
Table 4‑1 lists the supported aggregate functions for totals and subtotals.
Table 4‑1 Aggregate functions
Function | Description |
Average | Returns the average, also known as the mean, of the values |
Count | Returns the number of values, including duplicate values |
Count Value | Returns the number of values, excluding duplicate values |
First | Returns the first value among the values |
Last | Returns the last value among the values |
Max | Returns the largest value among the values |
Median | Returns the median, or middle, value among the values |
Min | Returns the smallest value among the values |
Mode | Returns the mode, or the value that occurs most frequently, among the values |
Standard Deviation | Returns the standard deviation of a set of values |
Sum | Returns the sum of the values |
Variance | Returns the variance of a set of values |