Using a mathematical calculation in a cross tab
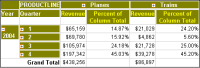
Figure 4‑10 shows a computed measure that displays the Percent of Column Total value for each revenue value. For example, in the Planes column, each Percent of Column Total value displays the percentage of the corresponding Revenue value divided by the revenue total for Planes, $438,256. The sum of Percent of Column Total values for each product line column is 100%.
Figure 4‑10 Displaying calculated data in the Percent of Column Total column
How to create a computed measure using the % OF function
The % OF function supports displaying percent-of calculations in the cross tab, such as comparing a revenue value in each cell to the grand total sum of all revenue cells in the cross tab.
1 Choose New Computed Measure.
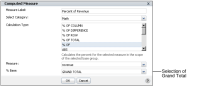
2 In Computed Measure, complete the following tasks, as shown in
Figure 4‑11.

In Measure Label, type text for the label. For example, type:
Percent of Revenue
In Select Category, select Math.
In Calculation Type, select % OF.
In Measure, select revenue
In % Base, select an item from the list. For example,
Figure 4‑11 shows the selection of Grand Total.
Choose OK.
Figure 4‑11 Selecting Grand Total to apply the % OF function
Figure 4‑12 shows the cross tab, displaying the Percent of Revenue column in which each percent value is a product line revenue value compared to the grand total revenue value for the cross tab, $525,153. The sum of all values in all Percent of Revenue columns is 100%.
Figure 4‑12 Displaying Percent of Revenue values for each product line revenue value compared to the cross tab Grand Total