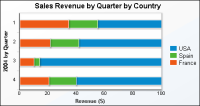
In a percent stacked bar chart, multiple series are stacked horizontally, and the values appear as a percent of the whole. As you can see in
Figure 6‑9, the sales values appear as percentages of the whole, instead of the actual sales totals appearing in the previous bar charts’ illustrations.