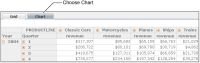
In Data Analyzer, choose Chart, as shown in Figure 6‑17.
Figure 6‑17 Choosing Chart
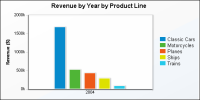
The chart appears, displaying the cross tab data, as shown in Figure 6‑18. This column chart, the default chart type, displays the sales revenue for each product line for 2004.
Figure 6‑18 Displaying cross tab data in a column chart