How to change chart appearance using a theme
If a developer provides a theme to apply to a chart, the library file that contains the theme typically resides in the Resources folder in an Encyclopedia volume, for example:
/Resources/ThemesReportItems.rptlibrary
To apply a theme to a chart, complete the following tasks:
1 Using Data Analyzer, view a chart.
2 Choose Theme.
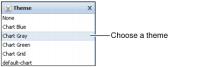
3 In Theme, choose a theme name. For example, choose Chart Gray, as shown in
Figure 6‑36.
Figure 6‑36 Choosing ThemesReportItems.Chart Gray theme
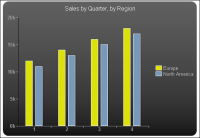
The theme applies to the chart. This Chart Gray theme displays light yellow and blue columns on a gray background color, as shown in
Figure 6‑37.
Figure 6‑37 Viewing a chart with the applied theme