Exporting content to Microsoft Excel format
Data Analyzer supports exporting a cross tab or a chart to Microsoft Excel (.xls) or Excel (.xlsx) format. The exported content in the Excel spreadsheet has the same layout as in the HTML page in Data Analyzer. The Excel spreadsheet supports the following Data Analyzer content:

A Data Analyzer cross tab exports to a pivot table in Excel.
Excel maintains the cross tab formulas in computed columns and aggregations.
Data Analyzer regular charts and Flash charts export to Excel as editable Excel charts.
Data Analyzer supports setting the following options for the exported XLS or XLSX spreadsheet:
Page range
To export all pages, leave the page range blank, which is the default setting. For multipage content, exported to Excel (.xlsx) format, you can specify a page range or specify the page numbers to export. Page range is not supported for content exported to Excel (.xls) format.
Text wrapping
Specify whether to wrap text in spreadsheet cells. Selecting this option can minimize the need for horizontal scrolling to view the exported spreadsheet.
Enable pivot table
Select this option to support Excel displaying a cross tab as a pivot table, providing the user with the ability to further analyze the data.
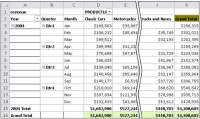
Figure 7‑5 shows a cross tab exported to a pivot table in Excel.
Figure 7‑5 Displaying an exported cross tab as a pivot table in Excel
Auto adjustment for pivot table
Export charts as images
If you select this option, Excel does not support your editing the chart. To enable a user to edit the chart in Excel, deselect this option.
Enable live formulas
Select this option to enable exporting a formula, such as a computed measure calculation or an aggregation, to Excel.
Chart DPI
Specify the output dpi (dots per inch) for charts. To view the exported chart image in higher resolution, increase the dpi value, which can result in a larger output file size. The default value is 192 dpi.
Hide grid lines
Select this option to hide grid lines in the Excel spreadsheet. Hiding grid lines changes the appearance of the Excel spreadsheet to more closely resemble the cross tab viewed in Data Analyzer than in a spreadsheet.
Output to multiple sheets
To view output on multiple sheets, select this option. Selecting this option does not maintain pagination properties when exporting multipage content.
How to export content to Microsoft Excel format
1 Choose Export Content.
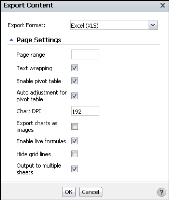
2 In Export Content, in Export Format, select Excel (XLS), as shown in
Figure 7‑6. Alternatively, select Excel (XLSX).
Figure 7‑6 Selecting Excel format options in Export Content
3 In Page Settings, specify which of the following options to apply to the exported Excel spreadsheet, as shown in
Figure 7‑6:
Page range
Text wrapping
Enable pivot table
Auto adjustment for pivot table
Chart DPI
Export charts as images
Enable live formulas
Hide grid lines
Output to multiple sheets
Choose OK.
4 In File Download, choose one of the following options:
Choose Open to display the chart or cross tab content as an Excel worksheet (.xls) or Excel worksheet (.xlsx) file.
Choose Save to provide a file name and location to which to save the chart or cross tab content as an Excel worksheet (.xls) or Excel (.xlsx) file. Then, you can open the file.
When you open the file, the content appears in Excel.