Creating a filter
To create a filter, define a condition, specifying which data to display in your cross tab. A filter condition is an If expression that must evaluate to true for data to be included in the cross tab. Examples of filter conditions are:

If the order date is between 4/1/2010 and 6/30/2010
If the sales office is San Francisco
If the sales revenue is greater than $30,000
If the sales value in the Spain row is less than or equal to the sales value in the France row
When you create a filter, the available options differ, depending on the following choices:
To which dimension or measure, or row or column, do you want to apply the filter?
Which comparison operator do you want to use to create a filter expression?
For example, if you select Greater Than, you provide one value to which to compare a data value. If you select Between, you provide two values for the comparison. If you select Any Of, you provide one or more values for the comparison.
Figure 5‑1 shows an example of a filter condition to apply to a revenue value, a measure. When defining this filter condition, you can break it down into the following parts, as shown in
Figure 5‑1:
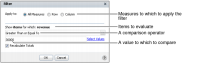
Figure 5‑1 Creating a filter to compare values
The measures to which to apply the filter
The items to evaluate, such as revenue
A comparison operator, specifying the type of comparison test, such as Greater Than or Equal To
A value to which to compare, such as 30000
The option to recalculate totals
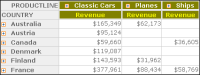
The cross tab displays revenue values greater than $30,000, as shown in
Figure 5‑2.
Figure 5‑2 Displaying filtered values
Figure 5‑3 shows an example of a filter condition to compare revenue values in the Spain row to revenue values in the UK row. When defining a filter condition, you break it down into the following parts, as shown in
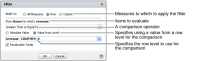
Figure 5‑3:
Measures to which to apply the filter, such as the measures in a row
The value to evaluate, such as revenue
A comparison operator, specifying the type of comparison test, such as Greater Than or Equal To
Selected Value from Level option, which indicates the comparison to a value in another row level
Alternatively, selecting Absolute Value supports providing a comparison value in the following field.
A row level to which to compare, such as revenue - COUNTRY:UK
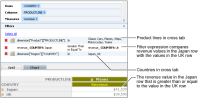
Figure 5‑3 Creating a filter to compare values in specific rows
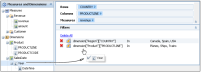
The cross tab displays the revenue value in the Japan row that is greater than or equal to revenues in the UK row. Also, the filters pane displays the applied filters, as shown in
Figure 5‑4.
Figure 5‑4 Displaying filtered values
Also, you can create a filter that applies to an attribute or dimension, which does not appear in the cross tab preview pane. For example, apply a filter to an attribute or dimension that appears in the cube data, and which narrows the scope of the data that appears in the cross tab.
Figure 5‑5 shows a cross tab in which the following filter applies to the cube data:
dimension["SalesDate"]["Year"] Equal to 2004
The cross tab filters revenue values and displays those values for only the year 2004. The date dimension does not appear in the cross tab preview pane.
Figure 5‑5 Applying a filter on a dimension that does not appear in the preview pane
To create each filter, you define a filter condition. You can create multiple filters to display relevant data. Each filter you add further narrows the scope of data displayed. For example, you can create a filter that returns data where the customer’s credit rank is either A or B and another filter that returns open orders between $250,000 and $500,000. Each additional filter introduces complexity to the cross tab. Make sure you design and test multiple filters carefully. If you have too many filters that narrow the scope of the cross tab, no data appears in the cross tab.
For more information about comparison operators to use when you create filter condition expressions, see
Operators supported in conditional formatting and filter condition expressions.
How to create a filter that uses a cross tab value
You can use this procedure to create a filter that uses an attribute, dimension, or measure value that appears in the cross tab preview pane.
1 Right‑click a cross tab cell that contains a value to evaluate. From the menu, choose Filter.
2 In Filter, select one of the following to which to apply the filter. Depending on which cross tab cell you right-clicked in step
1, Row or Column might not appear on Filter.
All Measures
Row
Column
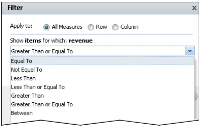
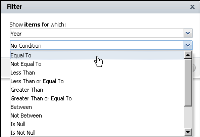
3 In Filter, from the list shown in
Figure 5‑6, select the comparison test, or operator, to apply to the attribute, dimension, or measure. Depending on the comparison operator you select, Filter displays either one or two additional fields or a completed filter condition.
Figure 5‑6 Selecting a comparison operator
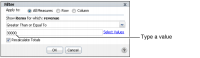
4 If you select an operator that requires a comparison value, specify a value in one of the following ways:
Figure 5‑7 Typing a value for the filter condition
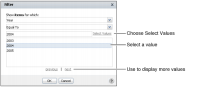
Choose Select Values to select from a list of existing data values.
Figure 5‑8 shows how you can select product line values from a list. When they are available, use the previous and next buttons to display more values.
Figure 5‑8 Selecting a value for the filter condition
Choose List Values to select from a list of existing data values.
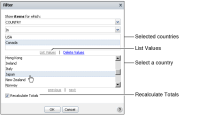
Figure 5‑9 shows how you can select country values from a list for the In operator. When they are available, use the previous and next buttons to display more values.
Figure 5‑9 Selecting a value for the filter condition
5 To recalculate the cross tab totals, select Recalculate Totals.
Choose OK to apply the filter. If the cross tab contains no data that matches the filter condition, the cross tab does not display any data.
How to create a filter that does not use a cross tab value
You can use this procedure to create a filter that uses an attribute or dimension value that does not appear in the cross tab preview pane.
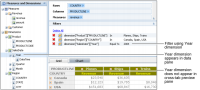
1 From the data pane, drag an attribute or dimension, and drop it in the Filters area of the structure pane. For example,
Figure 5‑10 shows dragging the Year dimension to the Filters area.
Figure 5‑10 Dragging a dimension from the data pane to the Filters area
2 In Filter, from the list, select the comparison test, or operator, to apply to the attribute or dimension, such as Equal To, as shown in
Figure 5‑11.
Figure 5‑11 Selecting a comparison operator
Depending on the comparison operator you select, Filter displays either one or two additional fields or a completed filter condition.
3 If you select an operator that requires a comparison value, specify one or more values in one of the following ways:
Figure 5‑12 Typing a value for the filter condition
Choose Select Values to select one value from a list of existing data values.
Figure 5‑13 shows how you can select a Year value from a list. If they are available, you can use the previous and next buttons to display more values.
Figure 5‑13 Selecting a value for the filter condition
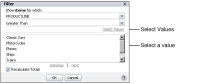
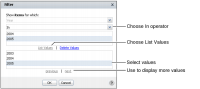
Choose List Values to select one or more values from a list. For example, the In operator supports selecting multiple values.
Figure 5‑14 shows selecting two Year values for the In operator. If they are available, use the previous and next buttons to display more values.
Figure 5‑14 Selecting a value for the filter condition
Choose OK to apply the filter. If the cross tab contains no data that matches the filter condition, the cross tab does not display any data.